Valgenesis Gateway
Project
The Gateway project is one of the most interesting and innovative projects in pharmaceutical equipment.
It involves creating a simple dashboard to track and monitor all activities for all types of pharmaceutical equipment and instruments.
Users can easily configure and connect to the dashboard to track all the necessary parameters defined for specific equipment, ensuring that all the equipment performs in the best conditions.
My role
UX Lead/ Team lead
Responsible for running design workshops to define the scope of the project.
Creating a customer journey map for the product
Conducting stakeholder interviews with key team members
Refining the design operation processes and iterating over designs
Objective
The main objective was to understand the root pains of the whole product flow and divide them into different chunks of project release.
We also wanted to provide an easy way for pharma companies with thousands of equipment to check their equipment’s parameters (temperature, humidity, and so on). Configuring and tracking data is a super complex task as connectors must also be connected to a specific data hub in the network.
Research method
Customer and stakeholder interviews
Participatory design
Customer journey mapping
Task flow analysis
Detailed case study will be shown
As a quality control manager at a pharmaceutical company, imagine being able to track crucial lab data seamlessly from a single, intuitive dashboar no headaches, no chaos, just efficiency.
This was the vision behind the Gateway Project, a groundbreaking initiative to create a state-of-the-art dashboard for monitoring pharmaceutical equipment. , I was entrusted with turning this vision into reality.
Our goal? Simplify the complexity of managing thousands of pharmaceutical instruments while ensuring every parameter is monitored with pinpoint precision.
Discovery Phase: Understanding the Root of the Problem
Every project begins with a deep dive into users’ challenges, and the Gateway Project was no different. We started by conducting stakeholder interviews with key players—engineers, lab managers, and compliance officers—people who dealt with the pain points firsthand.
Crafting Personas for the Gateway Project: A Story of Exploration and Empathy
During the Gateway Project, we realized that creating a successful pharmaceutical equipment monitoring dashboard meant understanding the diverse users, including lab technicians, plant managers, quality analysts, and executives. This led us to use personas as the foundation of our design process.
Discovering Our Users: The Kickoff Workshop
In the early stages, we conducted a series of workshops with stakeholders to map out the scope of the project and identify our end users. The goal was to answer a simple but critical question:
Who are we designing for?
We gathered insights from key stakeholders in pharmaceutical companies, identifying multiple departments involved in equipment management, each needing access to crucial data and insights from the same dashboard.
One of the stakeholders posed a particularly important question during a session: “Do we know which persona is the key decision-maker?” This prompted a deeper investigation into not just the users but also the decision-makers who would influence the product’s success.
Mapping Out the Personas: The Sticky Note Session
Armed with the insights from our workshops, we organized a persona-building session. We created sticky notes for each potential persona using a virtual whiteboard, organizing them by roles and responsibilities. This visual representation helped us get a clearer picture of the key personas interacting with the Gateway dashboard.
The image above illustrates how we categorized the users.
The design challenges we faced were categorized into the following areas:
- Simplifying Data Complexity: The platform managed large volumes of real-time data. Our challenge was to present this information in a intuitive manner without sacrificing important details.
- Creating a Scalable Design: With the addition of new functionalities, the design needed to support future growth effectively.
- Aligning Stakeholder Goals: Balancing technical constraints, user needs, and business priorities required close collaboration among various teams.
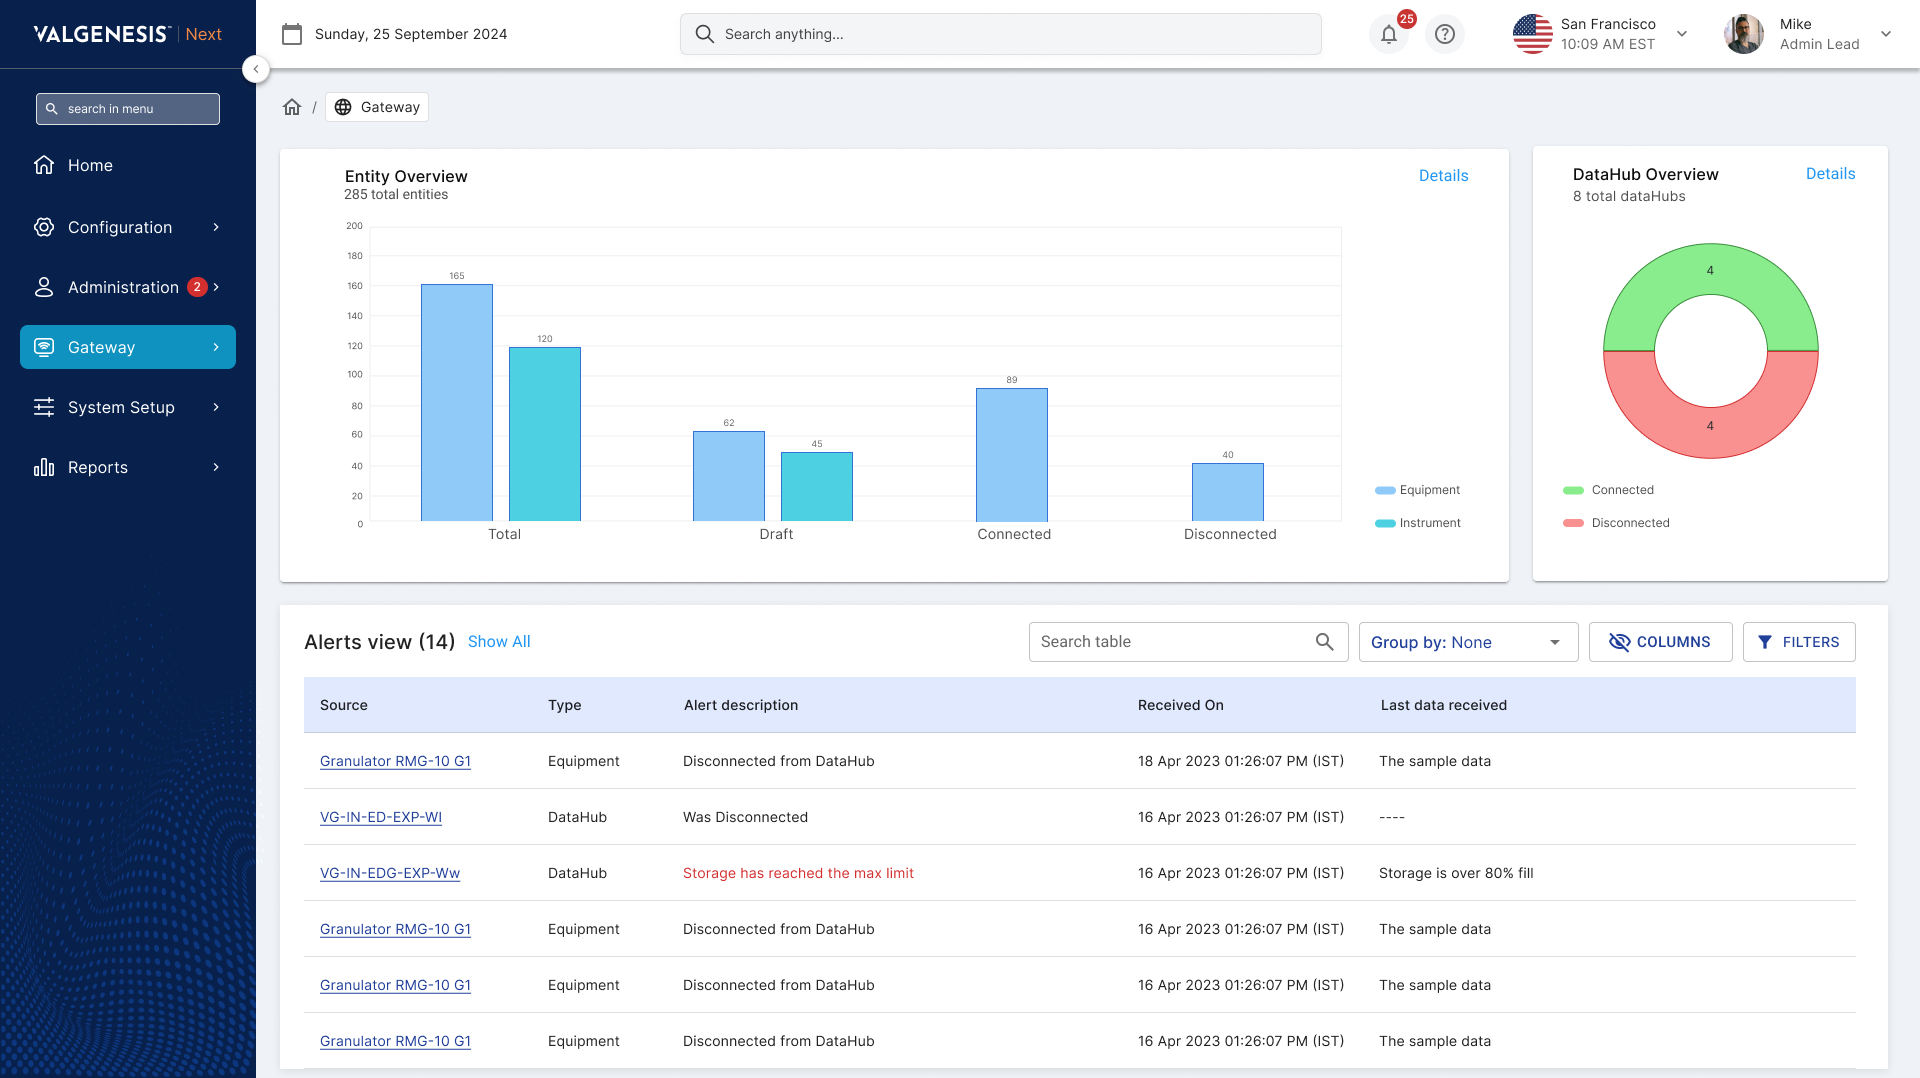
Iteration 1 final result main screens:
Gateway main dashboard has three main components: Entity overview, DataHub Overview, and a section to receive any alerts regarding any equipment or instrument that has problems
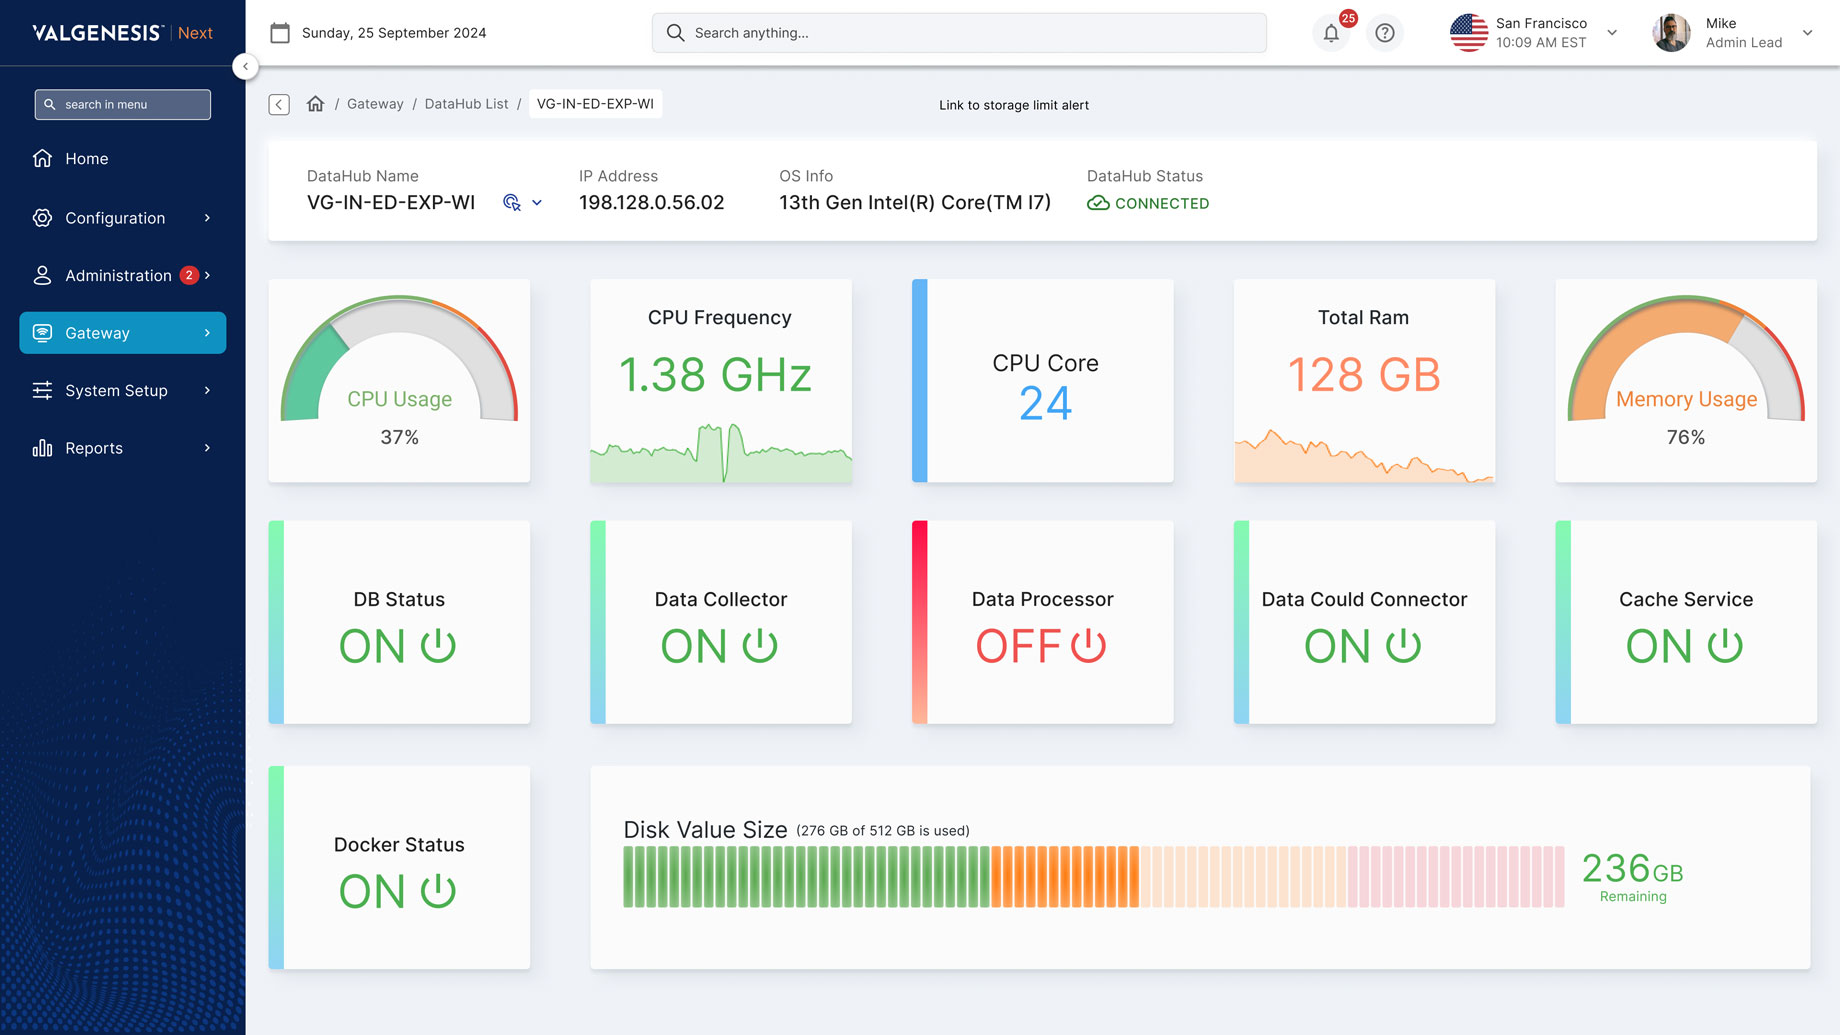
DataHub Dashboard
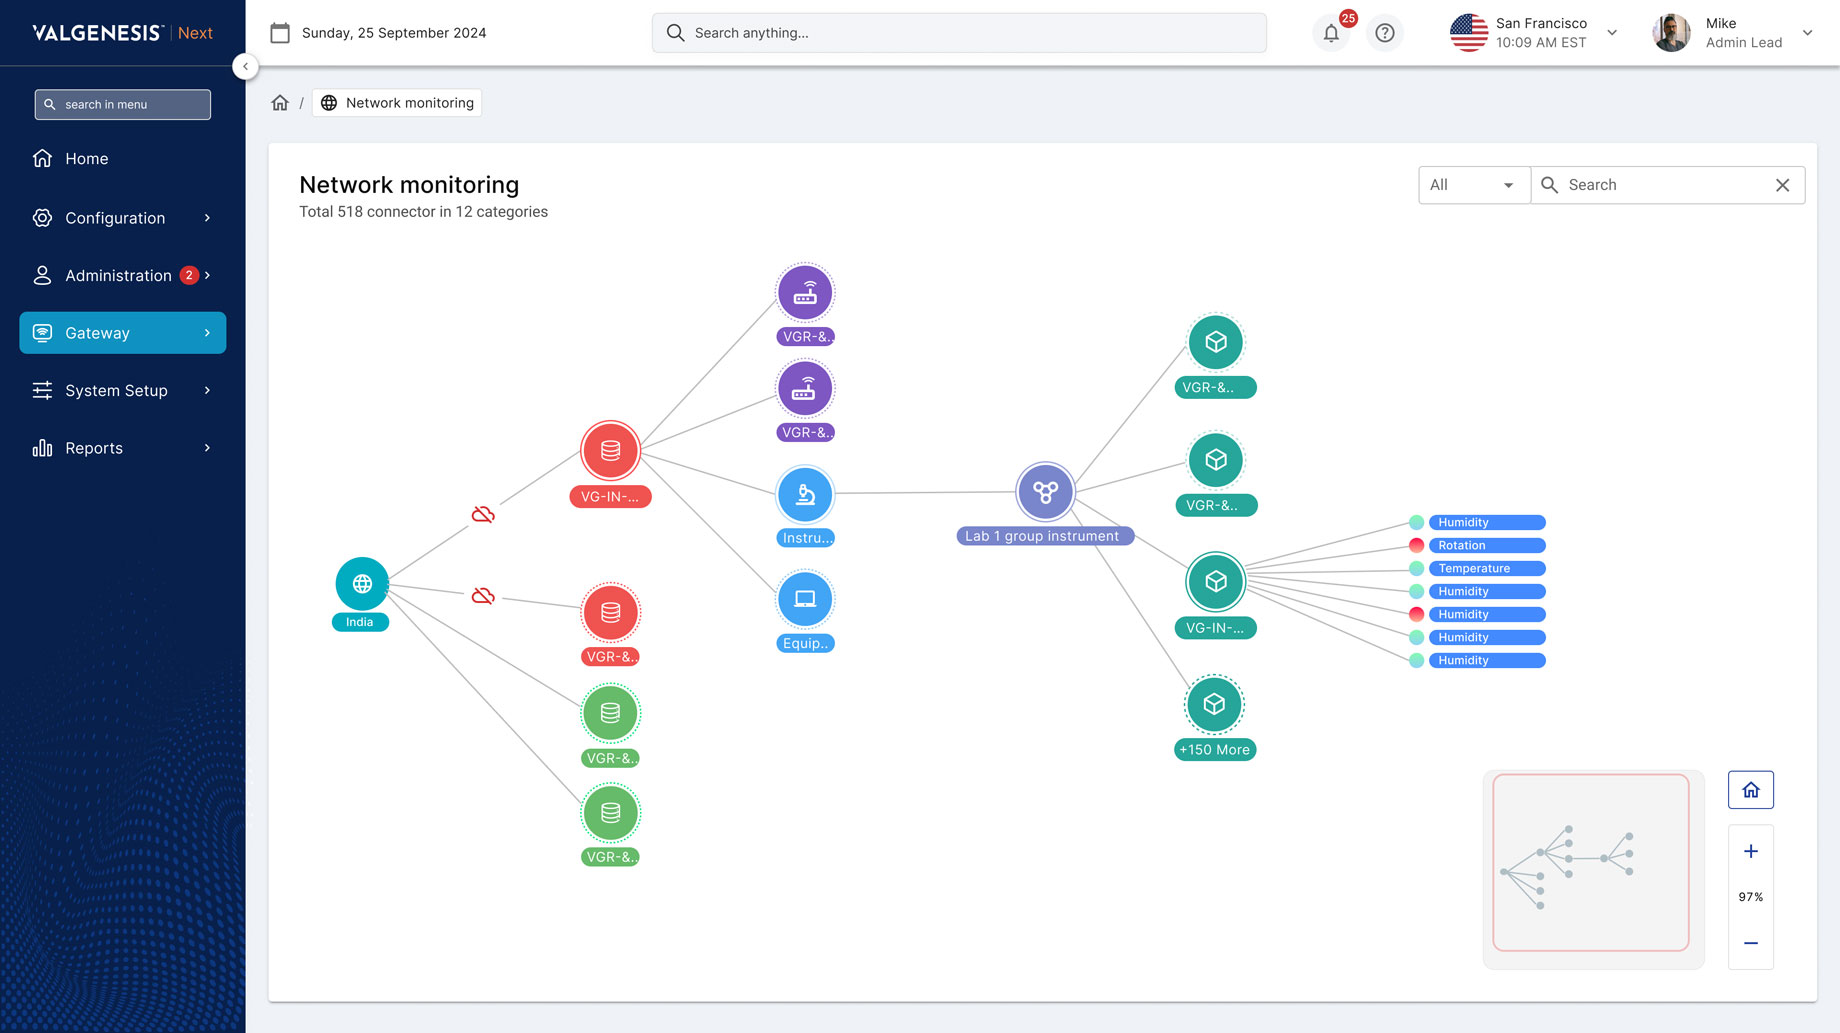
Network Monitoring Dashboard
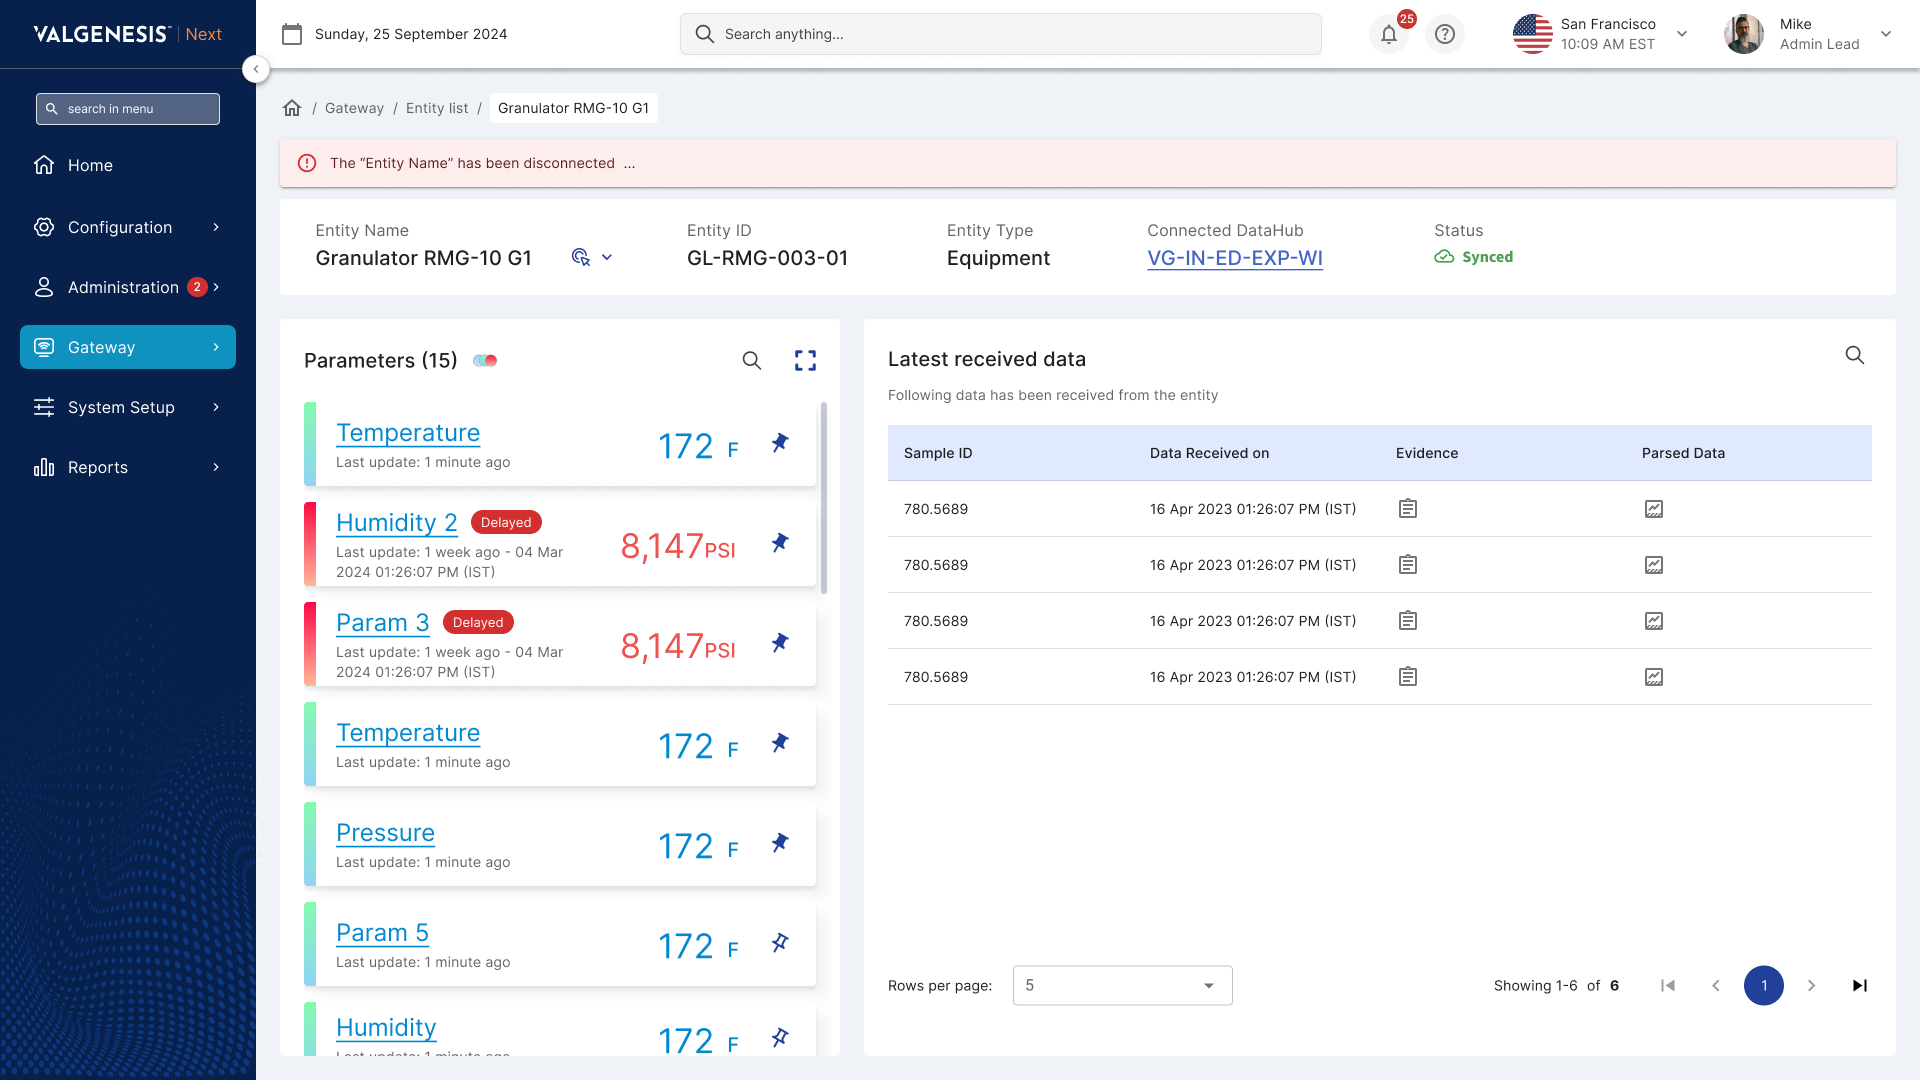
Connector (Entity) Dashboard
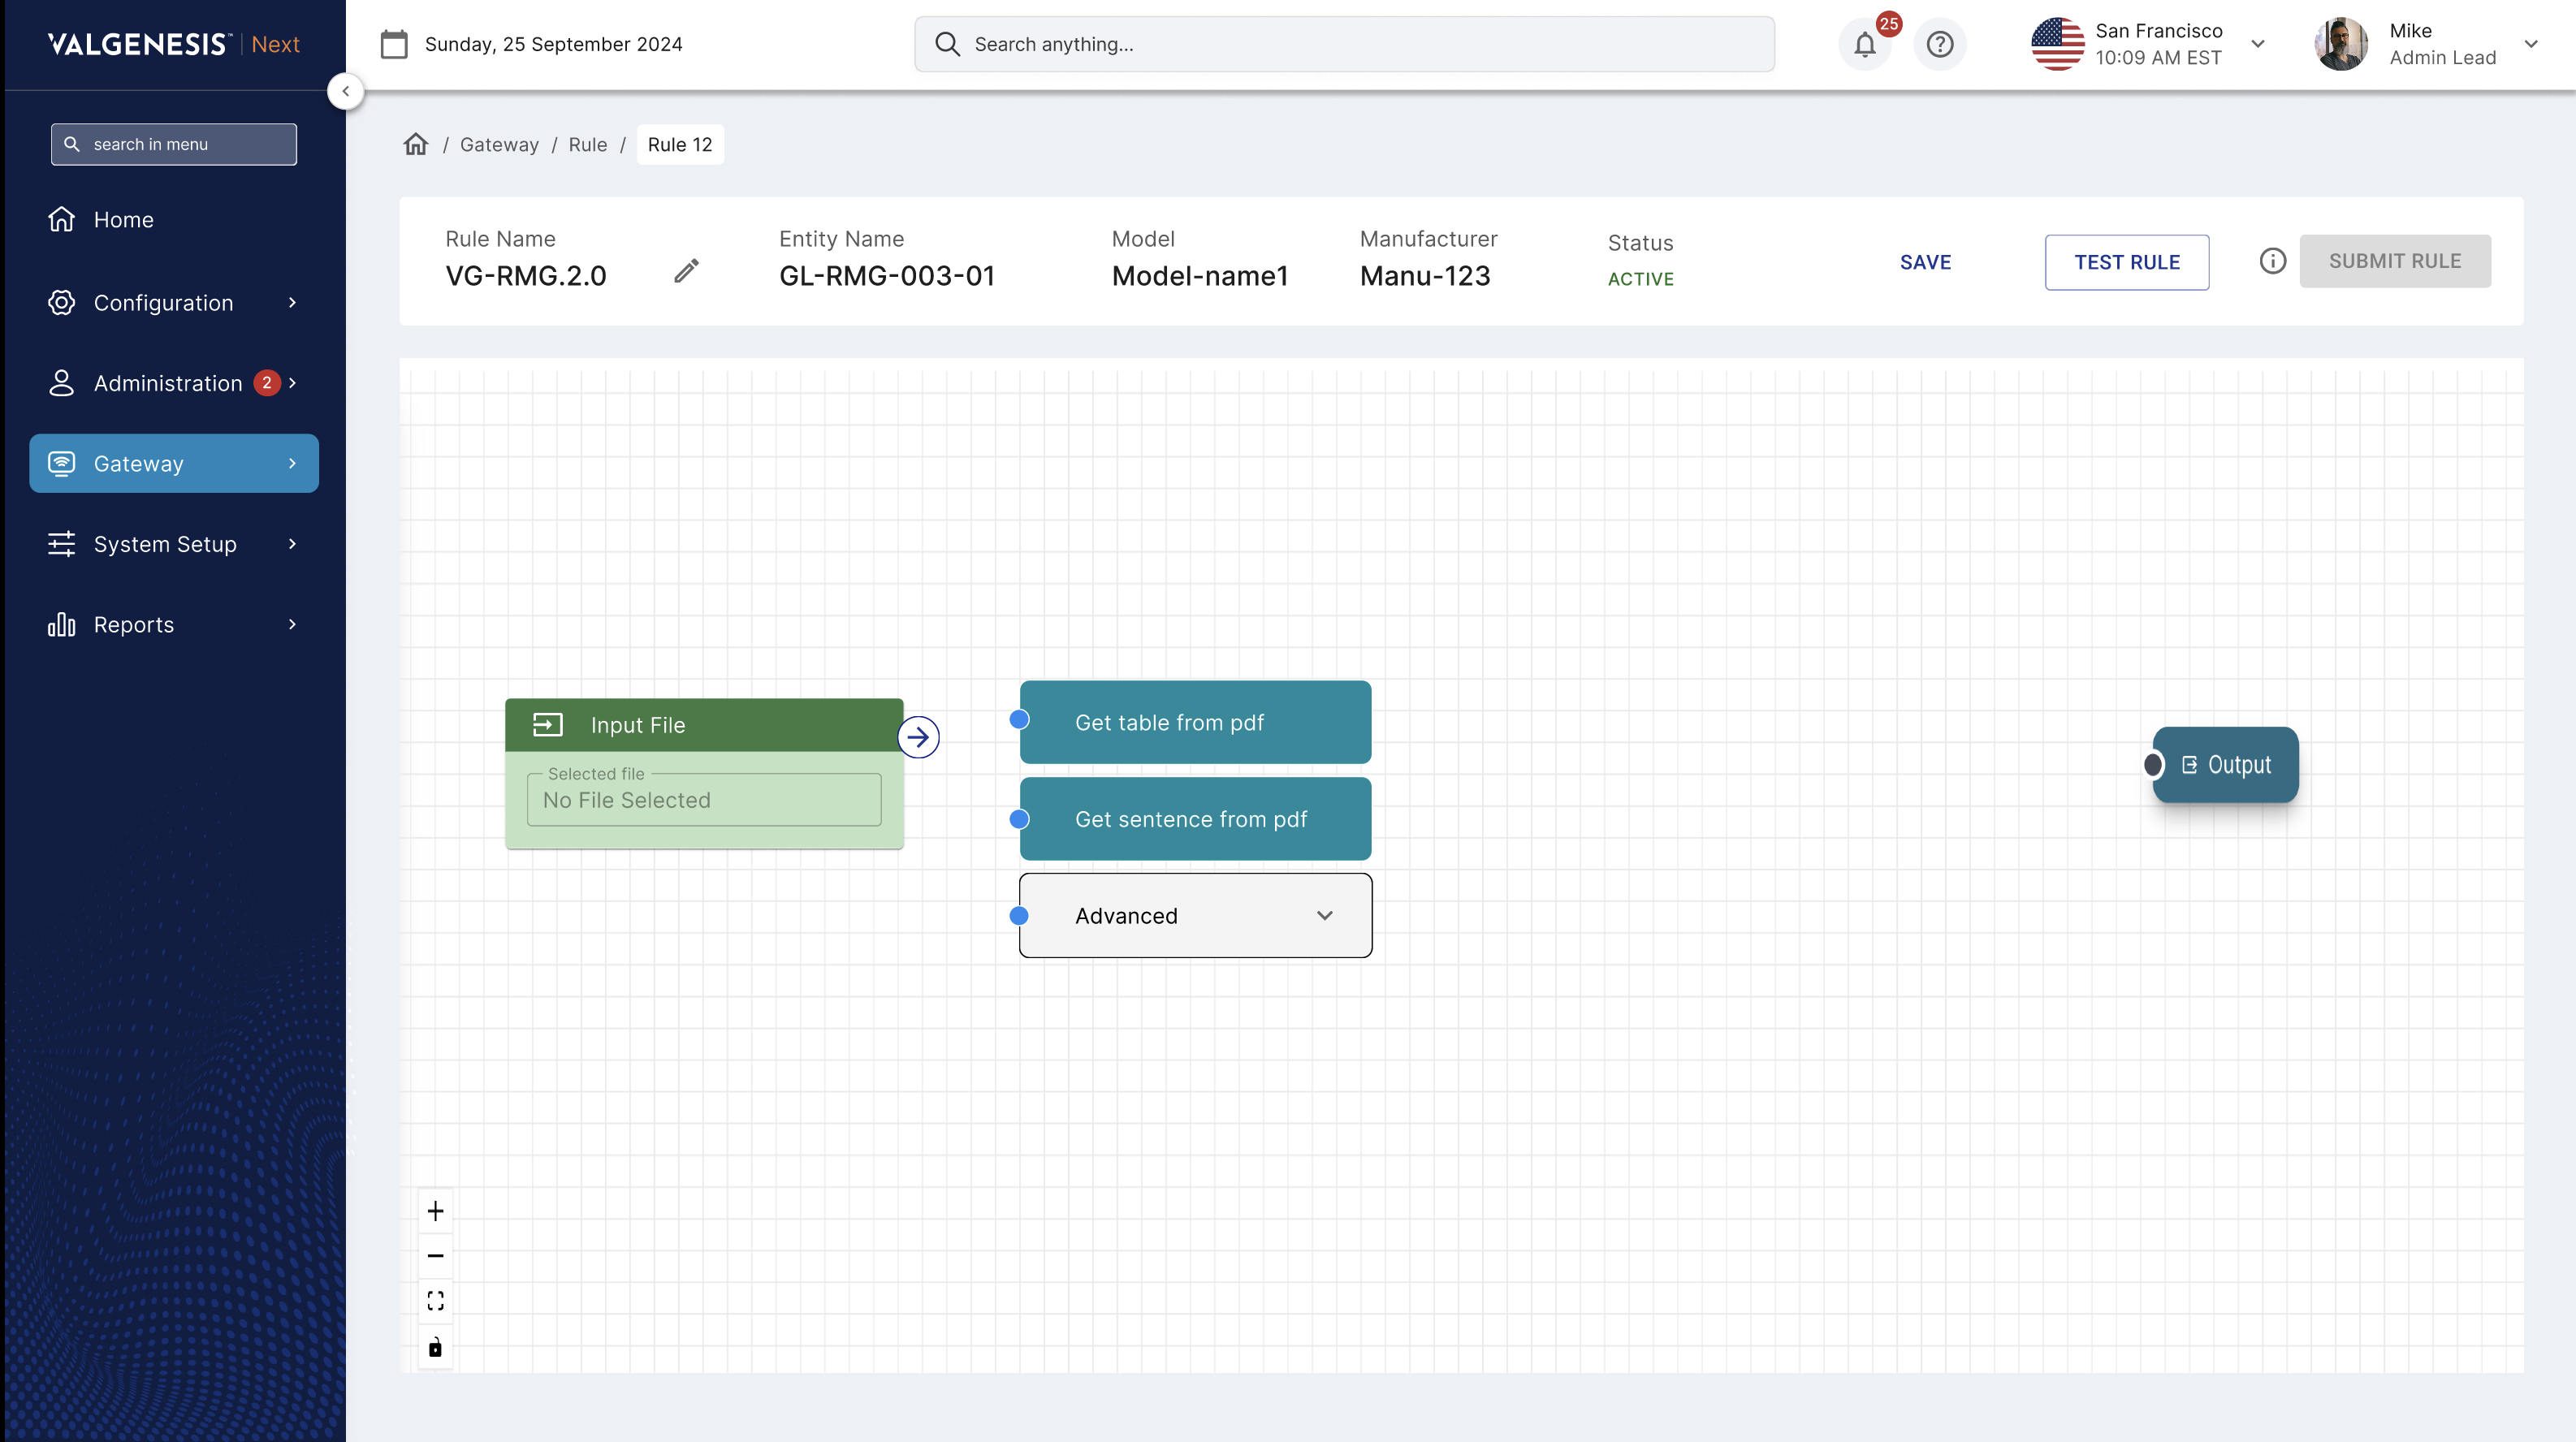
Rule Engine Creation (for extracting data)
In the project, while our primary focus was on delivering a user-centered and highly functional design, we also recognized the need to improve design operations (DesignOps) to streamline collaboration and ensure consistency. DesignOps enabled our cross-functional teams to work more efficiently, reduce complexity, and deliver a cohesive product faster. Besides designing intuitive dashboards and user flows, we managed to improve the design operations as follows:
Establishing a Cross-Functional Design Review Process
We implemented regular design reviews involving designers, developers, and stakeholders. These reviews ensured alignment between teams, identified potential issues early, and improved the overall design quality by incorporating diverse feedback for this module and inside the design chapter team.
Creating Design Documentation and a Shared Repository
We developed a centralized repository for all design guidelines, components, and documentation to reduce onboarding time and ensure consistency. This allowed team members to access the needed resources, enhancing productivity and collaboration quickly.
Using Automation Tools for Design Handoffs
We automated design handoffs by integrating tools like Figma plugins, providing developers with accurate specifications and assets. This reduced development cycles by 25%, minimized errors, and ensured a smoother transition from design to development.
Building and Maintaining a Scalable Design System
We collaborated closely with developers to create a scalable design system composed of reusable UI components and standardized design patterns. This system streamlined the development of new features and maintained a consistent user experience across all the platforms inside the organization.
Detailed case study will be shown


